6 Tricks to Use Google Analytics 4 for Product Analysis
Published September 23, 2022

Did you know that product analytics can be used to connect your data to your business goals? You can do this by focusing on user engagement and ensuring you have a comprehensive understanding of the entire user journey.
You may be wondering why you should care about your data aligning with business goals. The simple answer is that your data tells an important story that should be used to create your goals in the first place. The customer interactions and journey will tell you where and why your customers leave your site.
Below we discuss six Google Analytics 4 (GA4) tools you can use to analyze product metrics, which will enable you to optimize your site and drive conversions.
» Dissatisfied with your conversion rate? Follow these tips to increase your marketing efforts
1. Examine Customer Behavior With "Behavior Flow"
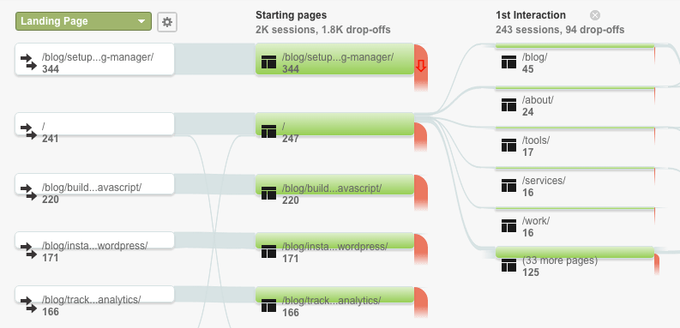
The behavior flow tool is a feature on Google Analytics that will highlight the journey your customers take while they're on your site, including all their interactions with your pages. It can tell you where they entered your site and where they exited.
This information will indicate which sections of your website are performing well content-wise and which sections may be problematic.
To find the tool, click on Behavior > Behavior Flow. You can then choose how you want to view your data: site section, automatically grouped pages, events, or pages and events.
2. Identify Popular Features Using "All Pages"
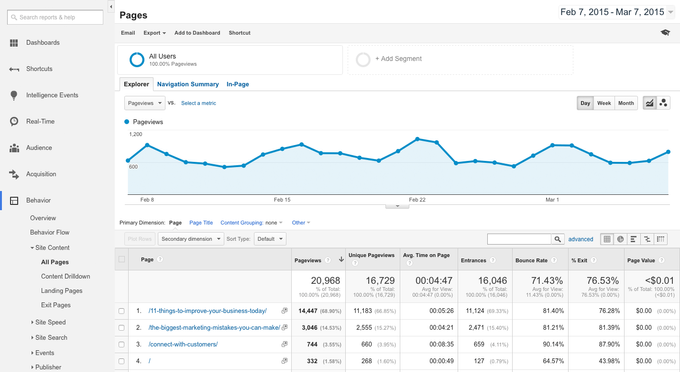
The "All Pages" tool measures which pages on your site have been viewed the most, thereby telling you which pages are more popular with your customers. It goes without saying that those are the pages that are working. You can use the information from your popular pages to improve on the pages that are getting less traffic.
To find the tool, click on Behavior > Site Content > All Pages.
» Need to increase your organic traffic? There are 8 easy strategies you can try
3. Leverage "In-Page Reports" to See What Users Click on
This tool tells you what your users are clicking on within each page. It gives you a good idea of how your customers are interacting with each of your pages, including bounce rate, the average time spent on pages, and how well your call-to-actions are working. This function can also help you track and boost sales via Google Analytics.
To find the tool, click on Reporting > Behavior > In-Page Analytics.
4. Leverage Google Analytics 4's Data Segmentation Tools
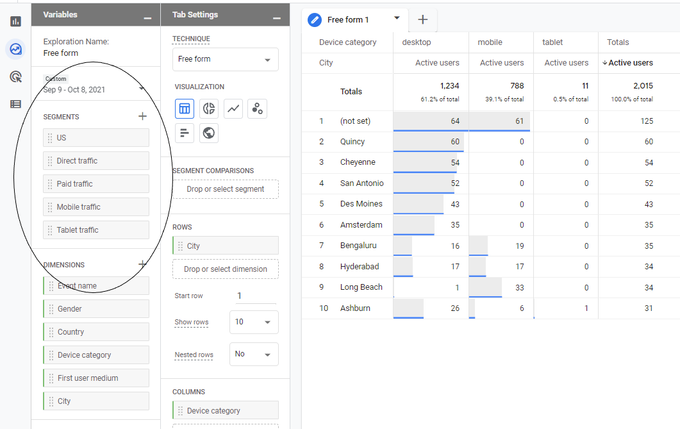
A segment is a subset of data, which you can use to analyze your users and gain valuable insights. In GA4, you can create segments through comparisons, explorations, and audiences:
- Comparisons: This is the simplest form of exploration and is only really used to guide you to deeper insights. It's a quick way to gather ideas and highlight trends.
- Explorations: Automated anomaly detection picks up unusual behavior. This will help you to get insights into user behavior that's different from normal.
- Audiences: This is the most useful tool out of the three. Audiences collects rather than calculates data. This means that it will include users from the day your site was officially up and running.
To find the tool, click on Explore > Exploration. You'll see that there are already several Explorations. You can use those or build your own new segments.
5. Determine Where Users Leave With "Exit Pages"
Exit Pages is a critical tool for your e-commerce store, because it tells you which page your customer was on when they decided to leave your site. This feature can help you detect any patterns in customer behavior, therefore allowing you to implement a strategy to combat exit rate.
To find the tool, click on Behavior > Site Content > Exit Pages.
6. Conduct A/B Tests via "Experiments"
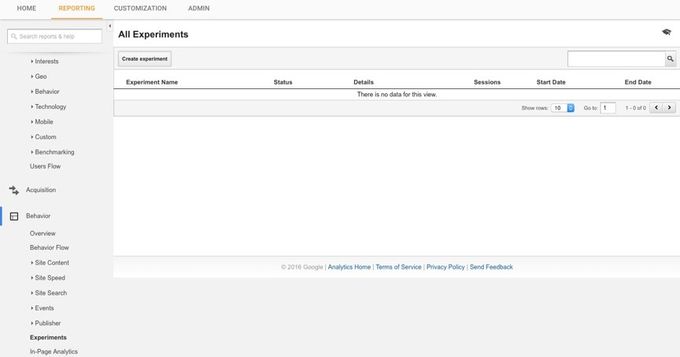
A/B testing, also known as split testing, is a randomized experimentation process where two or more versions of a web page or page element are shown to different users. These visitors get to view the different versions at the same time so that you can establish which version works the best and has the biggest impact. This includes testing elements like your headline or your call to action.
To find the tool, click on Standard Reporting > Content > Experiments. Alternatively, click on Behavior > Experiments.
» Need help navigating your sales funnel? Try one of these apps
Conclusion
Now that you know more about the handy analysis tools and features in GA4, you can leverage these tricks to improve your sales funnel with your GA4 micro and macro goals. You can also enhance your overall customer satisfaction and drive innovation with new product design and development initiatives.


