Top 10 Multi-Shop & Geos Metrics to Monitor in 2024
Updated March 13, 2024

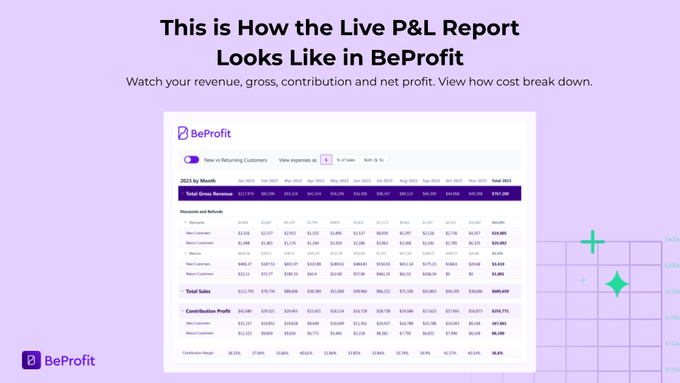
1. Contribution Profit & Expenses Breakdown (P&L)
Understand your profit (after deducting all variables expenses and marketing costs), and cost distribution for each store and sales platform.
See what you’re spending money on, and what are your biggest profit drainers.
Compare costs and service providers and see if there’s room for optimizations.
Play with monthly, quarterly, or weekly views, and check this for each store, several stores (when it makes sense to your operations), and your entire business.
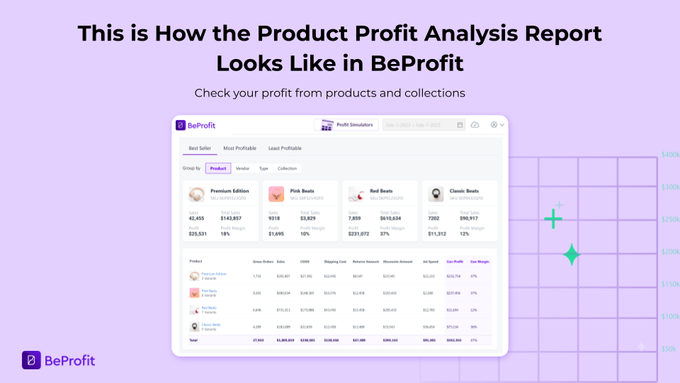
2. Product Cont. Profit
Understand your profit from products, variants, product types, vendors, and collections for each store, country, and sales platform.
Decide for each store which products are worth selling or not and which require adjustments in pricing, shipping charges, etc’.
Strategize your product bundles, upsells, promotions, free shipping threshold, and more.
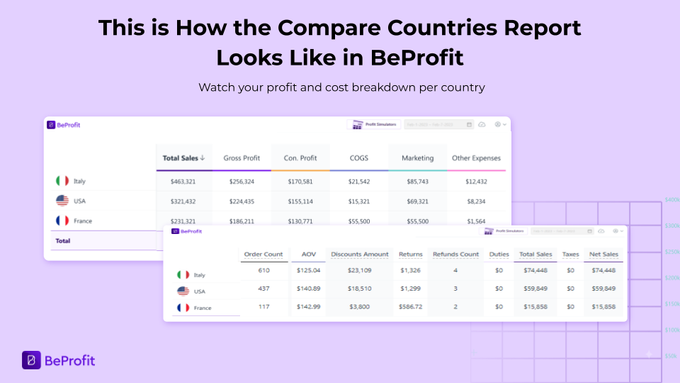
3. Contribution Profit and Margin per Country
As an online business manager, you need to know the profit you get from each country you operate in.
To track your contribution profit and margin per country, you need to include all variable expenses each country comes with (this includes tax, fulfillment, returns, COGS, and more).
Identify your most and least profitable countries, and understand their cost breakdown.
Pinpoint the excessive costs and see if you can minimize them, and rethink your operations in the countries with very minimal profit.
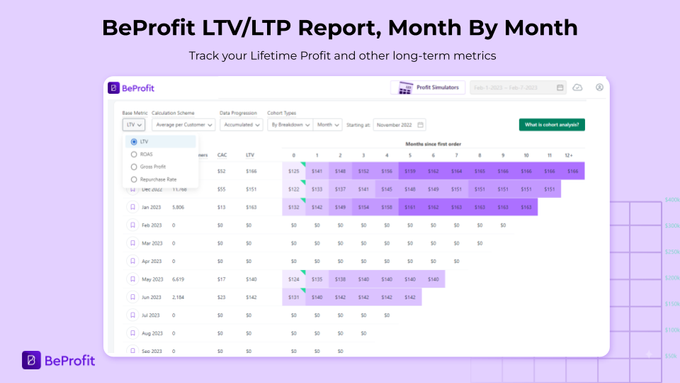
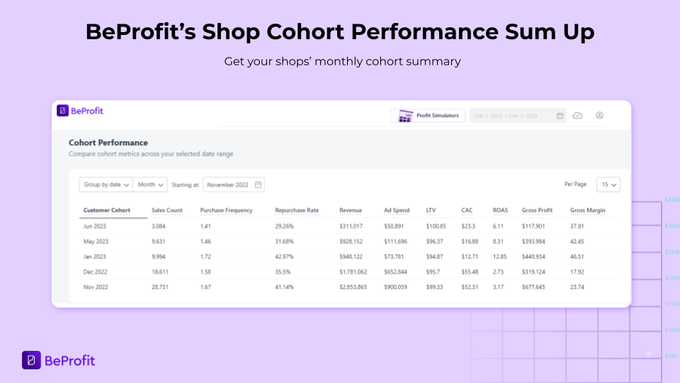
4. Shops’ Lifetime Profit
Understand how many new customers you bring for each one of your shops, how much they spend and their actual worth (Lifetime Profit) month after month.
Play with cumulative or individual customer views, and analyze your LTP by month, week, or quarter (changing perspective might reveal trends in profitability for customers acquired at different times of the year).
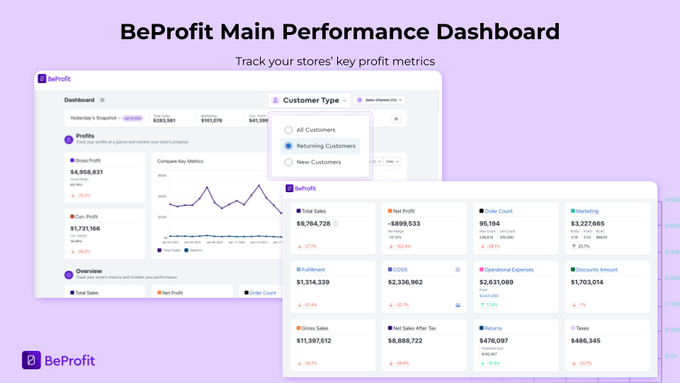
5. Profit from Returning Customers
Customer retention is one of the most important goals for online brands, and one of your main objectives is to increase their share from the profit pie for your stores.
Filter your shops’ view into new and returning customers to see how much each group contributes to your revenue, and bottom line.
Monitor returning customers’ contribution profit and share of your revenue, profit and order count, month by month, or quarter by quarter, to see if you’re successful.
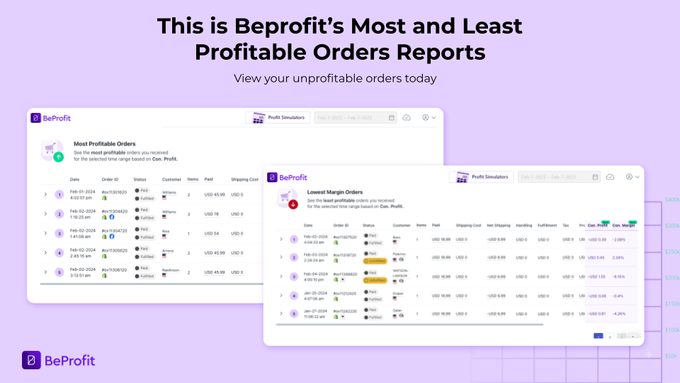
6. Non-profitable Orders
Track the percentage of your unprofitable orders for each of your shops, by country to understand your shops’, and overall business health.
Drill down to the main expenses that are killing these orders’ margins, see if you can optimize and where.
Place extra focus on upselling these customers.
Check your most profitable orders to see if you can replicate their success.
7. Average Shipping Contribution Margin
Review the average shipping con. margin by country for every shop.
Check for your top profitable shipping countries, their highest profitable carrier and shipping methods, and see if you can play with shipping offerings to be more competitive and increase sales for these shops.
An example: lower shipping prices for orders of two or more products. Test if you can stretch your free shipping threshold up a bit.

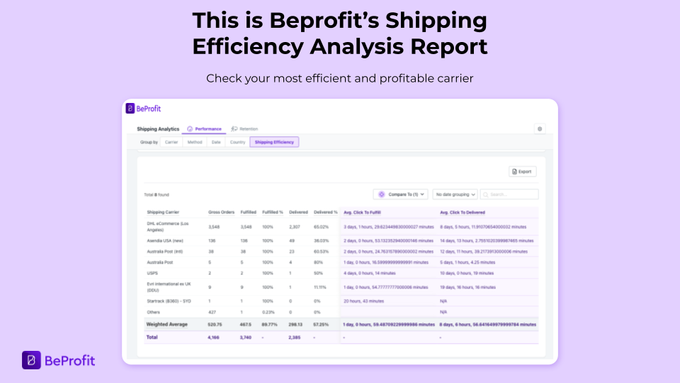
8. Shipping Efficiency
See how efficient and quick your stores are in fulfilling orders, and understand the carriers are helping to achieve this.
Then go check your top profitable shipping methods of these carriers and prioritize these methods that are both efficient and profitable.
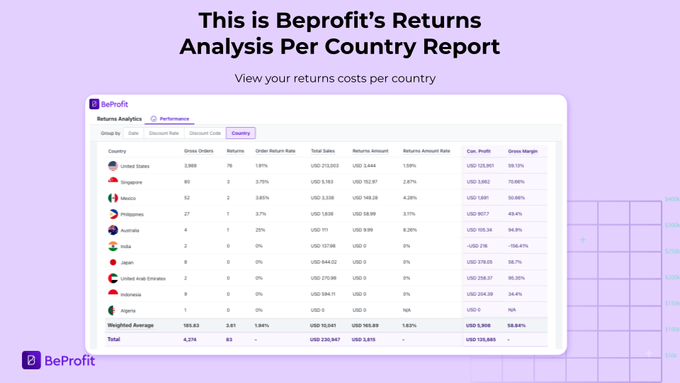
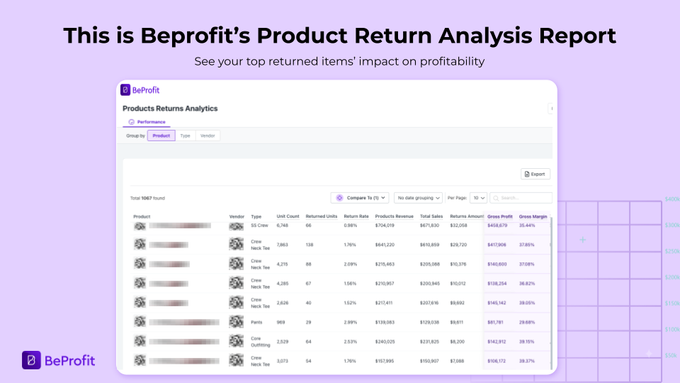
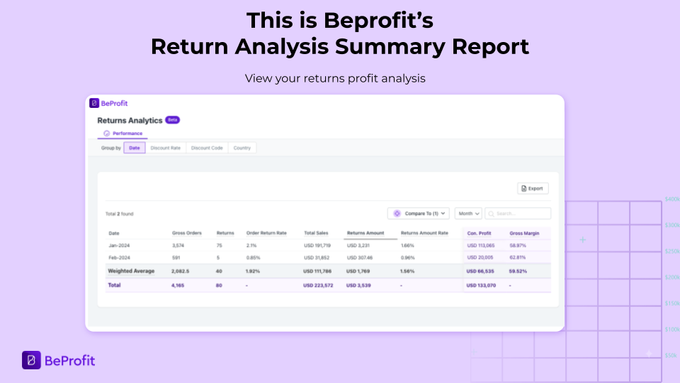
9. Return Rate and Cost
For each of your shops and brands, Identify locations with high return percentages and their cost. Find out which products are more frequently returned and have higher return costs.
Include your returns cost predictions into your profit calculations to achieve the most realistic profit picture.
Avoid offering steep discounts on these products in markets they are more likely to have additional costs for returns.
Consider adjusting your return policy to favor product replacements over returns.
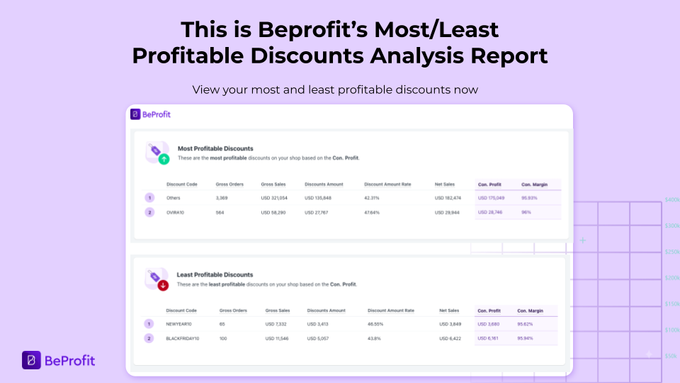
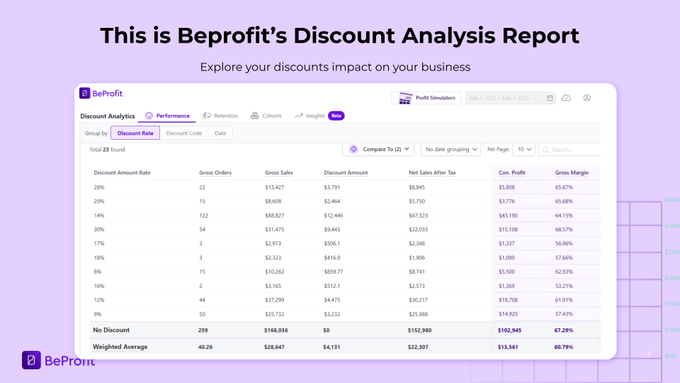
10. Discounts Con. Profit and Lifetime Profit
Many times, eCommerce leaders look at their discounts’ margins as a measure of the discount’s worth to their business.
We don’t see it this way. Why should you care about the margins if eventually, this coupon generated the most profit?
Explore the discounts that brought in the highest average contribution profit (con. profit divided by gross order number).
Check how many new orders they generated on average and consider their lifetime profit and AOV.
Prioritize discounts that enhance profitability rather than just revenue.