How to Calculate Revenue in Excel (Simple Formulas + Templates)
Updated May 5, 2023

Every seasoned business owner knows the value of revenue calculation as it helps them assess their profit, perform financial analysis, and do forecasting. So, how is sales revenue calculated? This article offers start-ups and established businesses alike straightforward Excel revenue calculation templates.
» Book a demo with BeProfit to learn more about the advantages of our revenue calculation solutions
5 Types of Revenue and Their Exemplified Calculations
This post will address the following revenue categories and provide a revenue formula in Excel for each:
- Incremental revenue
- Average revenue
- Gross revenue
- Quarterly revenue
- Marginal revenue
Calculate Your Revenue Effectively
Save time and effort by having your revenue calculated automatically.
- Analyzes data to guarantee constant, precise revenues.
- Integrates your stores into a single management system.
- Compatible with both desktop and mobile devices.
BeProfit offers an accurate and easy-to-use tool that will eliminate all the stress and strain associated with performing revenue calculations on your own.
1. Incremental Revenue
Incremental revenue is the profit a business receives from a certain increase in sales. This can refer to the additional revenue received from releasing a new product or service or trying new marketing strategies.
Therefore, the original revenue that would have been generated before the additional product or service was introduced in that period must be subtracted from the adjusted revenue that includes the new product or service.
Formula
A formula can therefore be constructed as follows:
Incremental Revenue = Adjusted Revenue - Original Revenue
- Adjusted Revenue = adjusted number of units sold x adjusted selling price
- Original Revenue = original number of units sold x original selling price
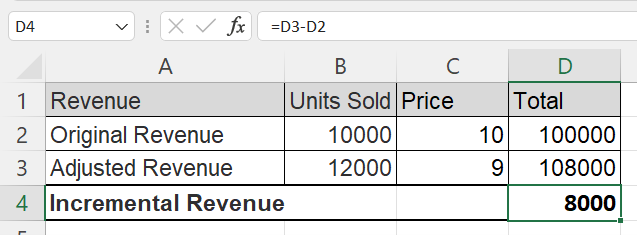
When using Excel, the calculation can be set up as follows:
- Original Revenue and Adjusted Revenue are listed separately.
- Incremental Revenue is calculated by subtracting the totals (=D3-D2).
» Delve deeper into the differences between incremental cost vs marginal cost
2. Average Revenue
Average revenue is earned for each unit, product, or service you sell. People also refer to it as average revenue per unit or per user (ARPU).
Formula
Average revenue is calculated by dividing the total revenue by the quantity sold:
Average Revenue = Total Revenue / Quantity Sold
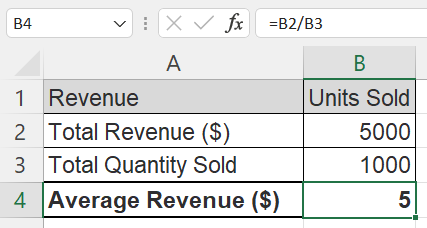
So, if a company's total revenue is $5 000 and the quantity sold is 1 000, then the average revenue per unit is $5 000 ÷ 1 000 = $5.
In Excel, the calculation can be set up as follows:
- Total Revenue and total quantity sold are listed separately.
- Average revenue is calculated by dividing the totals (=B2/B3).
» Find out how to track your revenue like the e-commerce giants
3. Gross Revenue
Your gross revenue is the total amount of money your company makes before expenses are deducted. This includes the sale of shares, property, and equipment, as well as interest and exchange rates.
Knowing your gross revenue will help you analyze your financial statements, track your sales volumes, and identify high-impact revenue channels to understand how well your business is doing.
Formula
There are two types of gross revenue: product revenue and service revenue.
Product Revenue = Number of units sold x Average price
Service Revenue = Number of customers x Average price of service
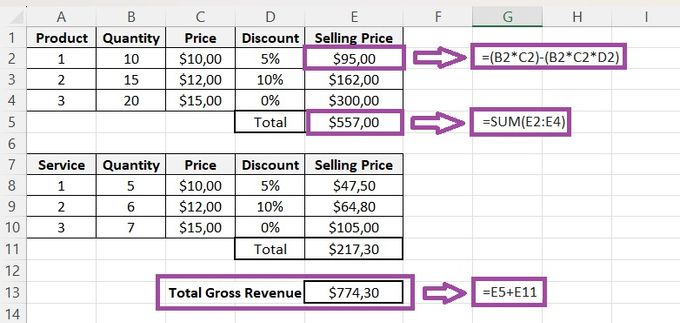
In Excel, the calculation can be set up as follows:
- Products and services are listed separately.
- Quantities sold, prices, and any discounts provided are used to calculate the final total selling price of each product and service.
- Total gross revenue is calculated by adding the final totals of products and services (=E5+E11).
» Explore the difference between gross profit vs gross margin for more insights
4. Quarterly Revenue
Quarterly revenue measures the increase in your sales from one quarter to the next. You would use it to review the sales of successive quarterly periods or compare the sales of the same quarter in different years.
It's important to note that quarterly revenue can be influenced by seasonal sales. For example, if the Olympics is hosted in a certain country, it may skew quarterly results and give you an inaccurate view of your company's quarterly revenue.
Formula
You can calculate quarterly revenue growth as follows:
[(Q2 - Q1) / Q1] x 100
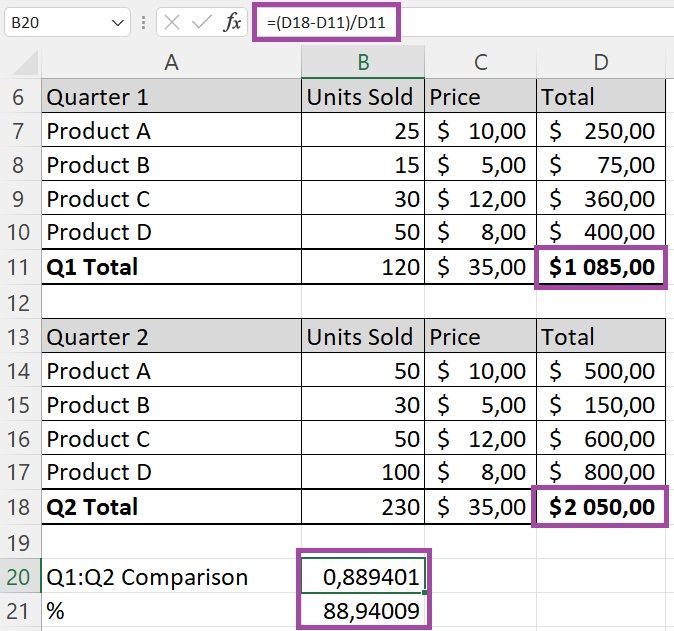
In Excel, the calculation can be set up as follows:
- Q1 and Q2 sales are listed separately with their relevant sales information (units sold, prices, and totals).
- The formula is applied at the bottom before it's converted to a percentage in the next row.
» Learn the 3 best Excel formulas for calculating markup vs margin
5. Marginal Revenue
Marginal revenue is the increase in revenue that you get from the sale of each extra unit of output. While marginal revenue can stay constant over a specific output level, it follows the law of diminishing returns and will eventually slow down as your output level increases.
As a business owner, you can use historical marginal revenue data to analyze customer demand for your products and determine your most efficient and effective prices. Finally, this calculation helps you understand your forecasts because it determines future production planning and schedules.
Formula
This is the formula you can use to calculate your marginal revenue:
Change in Revenue / Change in Quantity
=
(Total Revenue - Old Revenue) / (Total Quantity - Old Quantity)
Let's look at a quick example:
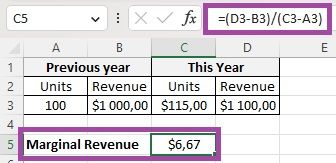
Your company sells its first 100 products for $1 000, so that's a selling price of $10. You sell the next products for $8. This means that your marginal revenue for product number 101 is $8.
It's important to note that marginal revenue disregards the previous average price of $10. This is because it only analyzes incremental change. If you sell 115 units for $1 100, your marginal revenue for products 101 through 115 is $100, or $6.67 per unit.
In Excel, the calculation can be set up as follows:
- The periods you're comparing are listed separately. In this case, it's simply indicated as "previous year" and "this year".
- Marginal revenue is calculated by applying the formula [=(D3-B3)/(C3-A3)].
» Learn more about the revenue vs product revenue discrepancy in GA4
Save Time With Precise Tools
There are profit calculation mistakes to avoid if you use the formulas and spreadsheets provided in this article. If you're not confident about how to calculate monthly revenue in Excel on your own, using the Profit Analysis Dashboard by BeProfit can save you time while ensuring your results are accurate.
Once the revenue has been calculated, the next step is to analyze and measure it using metrics such as net, gross, and operating profit margins. Knowing how to calculate net profit margins is essential because it provides insight into how effectively your business is running overall.
» Want to know how profitable your store is? Learn how to perform an e-commerce profitability analysis


