Nailing eCommerce Shipping: A Profit-Focused Analysis
Updated December 25, 2023

Introduction
Shipping is the crucial intersection where the online and offline worlds meet. It’s much more than just another expense - it's the final touchpoint with your customers, where promises are fulfilled, and loyalty is earned or vice versa.
Since Amazon set a very high shipping standard, many online businesses find it challenging to compete and offer the expected delivery services, as it can be quite costly.
This benchmark report dives into the world of shipping costs across different industries. We’ll break down the average cost per order, how much of an online store’s total expenses pie goes to shipping, how much it bites into profitability, and what customers are actually paying.
What We Tested
We’ve analyzed 2 million orders from 2022 from our unique database, zooming in on our five big industries: Clothing and fashion, Electronics, Beauty, Jewelry and accessories, and Home and garden.
Industry Shipping Costs Benchmarks
Shipping can go a long way for an eCommerce business. In 2023, 62% of online shoppers revealed they would abandon a purchase if free shipping wasn't offered, highlighting the undeniable influence of shipping strategies on consumer choices.
In this chapter, we will dive into the composition of shipping costs, exploring the distribution of expenses between businesses across different industries. Check out each industry’s biggest profit drainers and how much they take from their profit pie.
We’ll break down how much businesses are typically paying and the extent to which customers share the burden.
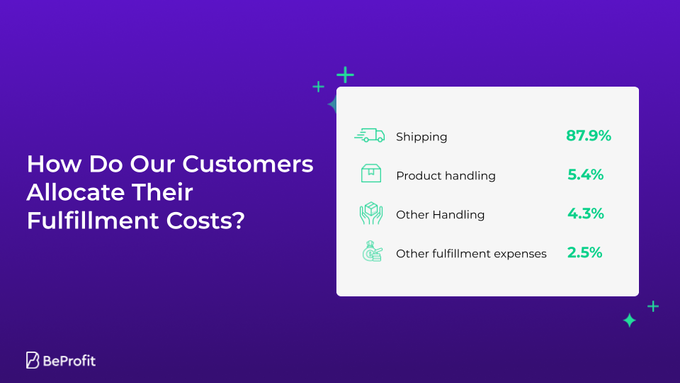
Breaking Down Fulfillment Costs
Fulfillment costs include shipping and handling, along with other expenses that businesses may track to assess their true profitability and the actual cost of package delivery. Unraveling these elements can be instrumental in optimizing your shipping strategy.
That’s why flexibility in calculating shipping fees is much needed. Shipping costs change according to package size and weight, some businesses would like to allocate portions of warehouse management costs as Operational Expenses (Opex) or under Other Expenses. And that’s exactly what you’ll see in our data.
Here’s a breakdown of what contributes to fulfillment costs, shedding light on how they stack up.
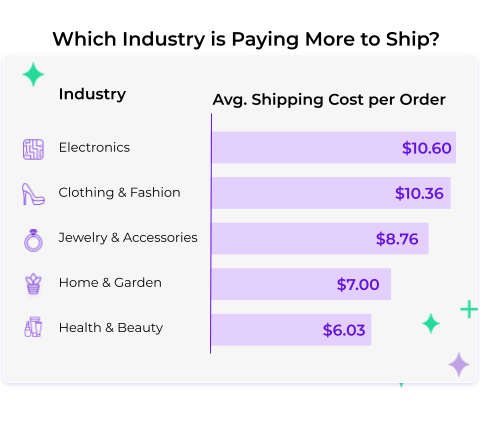
Average Shipping Costs Per Order
When it comes to shipping, some industries bear a larger burden than others.
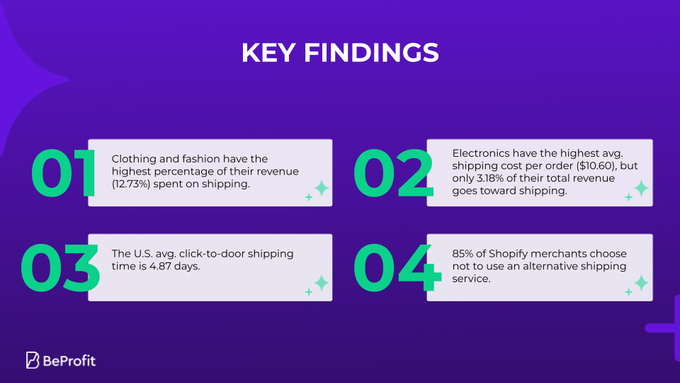
Electronics, for instance, has the highest average shipping cost per order, not surprising given the often fragile nature of these products. In contrast, beauty products have optimized economical shipping, boasting the lowest average cost per order at a mere $6.03.
This seemingly small cost difference is significant when scaled up to millions of monthly orders.
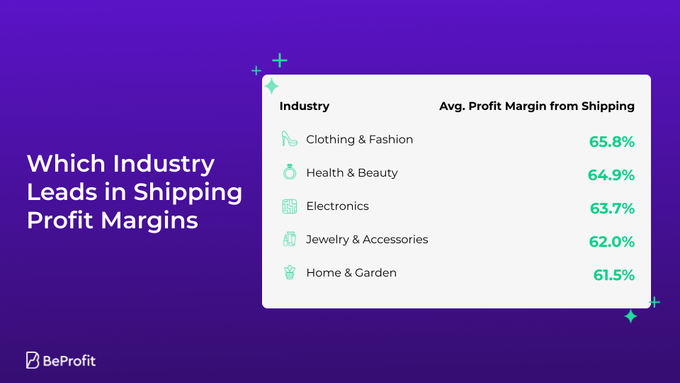
But this is just one piece of the puzzle. High shipping costs don't necessarily mean lower profitability. Let’s take a look at the average profit margins from shipping for these industries (our calculations don’t include marketing costs and OPEX).
Shipping Costs in Light of Total Revenue
Monitoring trends in your shipping costs helps identify sudden fluctuations in profitability due to changes in shipping prices or carrier operations.
This monitoring enables online businesses to turn their shipping strategies into profit-generating tools.
For clothing and fashion, a staggering 12.73% of their total revenue is devoured by shipping costs. On the flip side, electronics which had the highest average shipping costs now stands robust with only 3.18% of its total revenue going towards shipping.
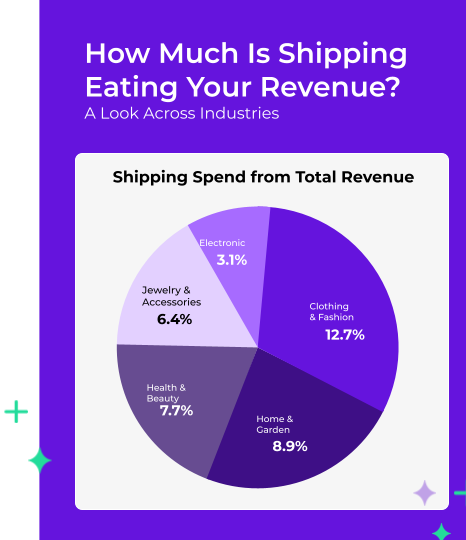
This brings a different perspective on cost optimization strategies. Are electronics industries doing something extraordinary? Let's dive deeper.
How does shipping carve into your bottom line?
Book a Short Demo | Free Trial
Striking the Balance in Customer Charge Rates
As we scrutinize how businesses manage their shipping expenses, it is apparent that there is a strategy for how costs are passed on to customers.
Some shops drop most of the shipping expenses on their customers and some prefer to bear the costs of shipping to increase sales and hopefully be more profitable overall.
Let’s see how our shops distribute their shipping costs.
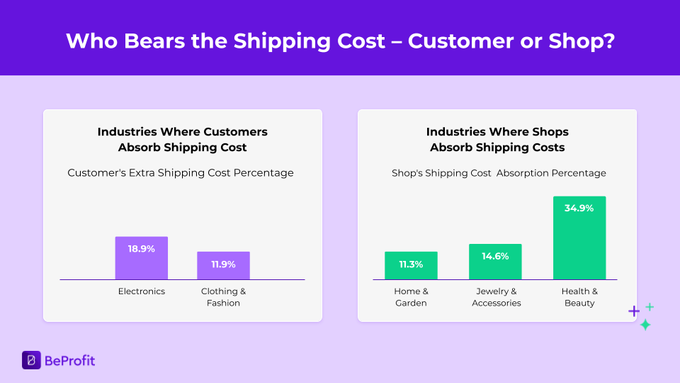
Splitting shipping costs between the store and your customers is a delicate balancing dance between customer affordability and business profitability. Use the industry data provided to refine your shipping strategy. Assess your current approach and consider whether a revision could enhance both customer satisfaction and your bottom line.
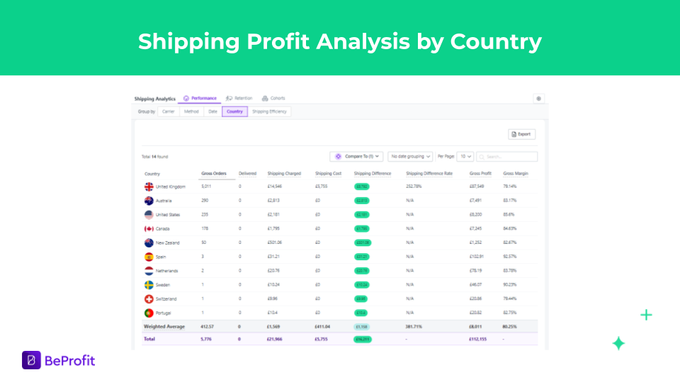
Profit Margins Across Different Shipping Destinations
Shipping worldwide is an exciting venture, it increases your audience and potential money making but it can also harm your profitability if you’re not on top of your financial shipping data.
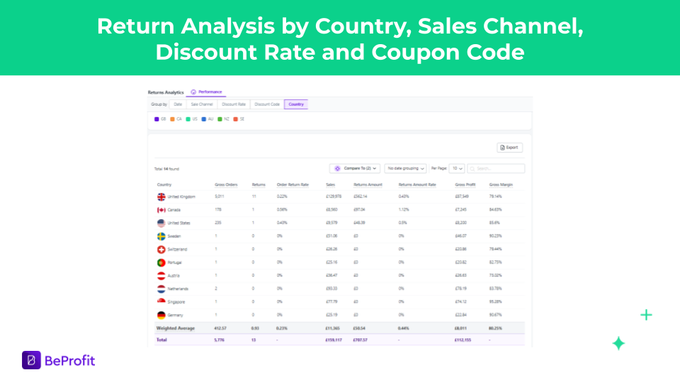
To stay on top of your most and least profitable shipping methods and carriers, countries, and their impact on LTV, AOV we offer our customers the following reports.
How does shipping carve into your bottom line?
Book a Short Demo | Free Trial
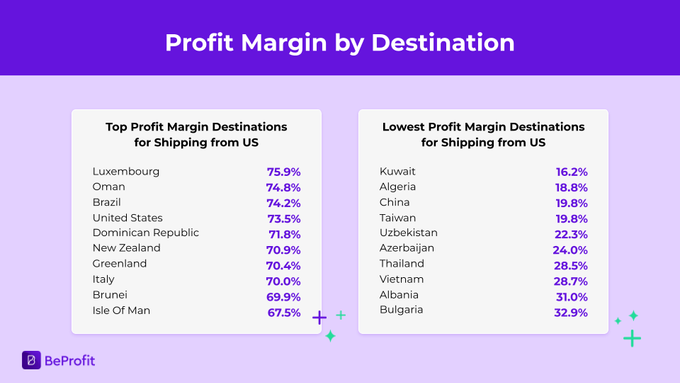
Top and Least Profitable Countries for Shipping from US
We've analyzed 50,000 of the most recent orders, taking into account different shipping carriers. This data offers a comprehensive look at profitability across various destinations, combining insights from all shipping providers. Here's what the data revealed about shipping from the US:
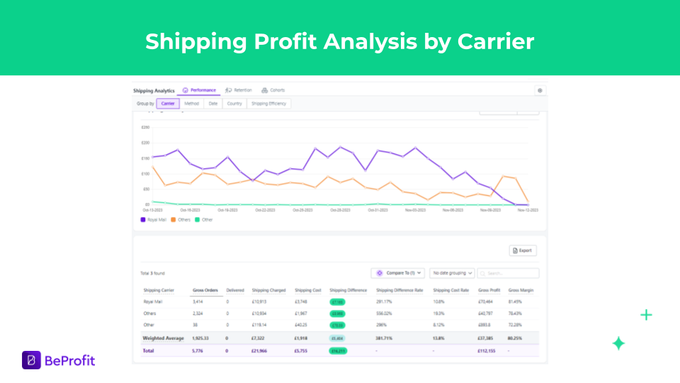
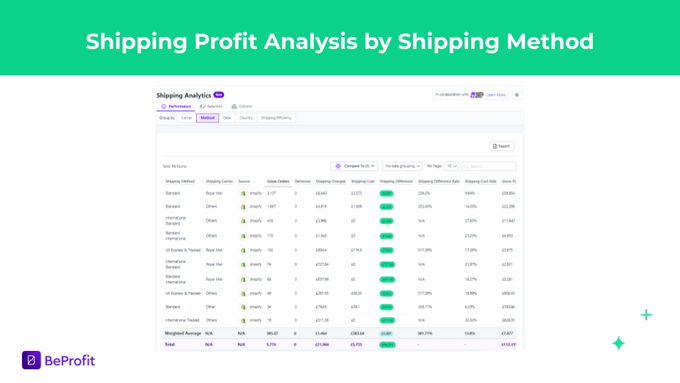
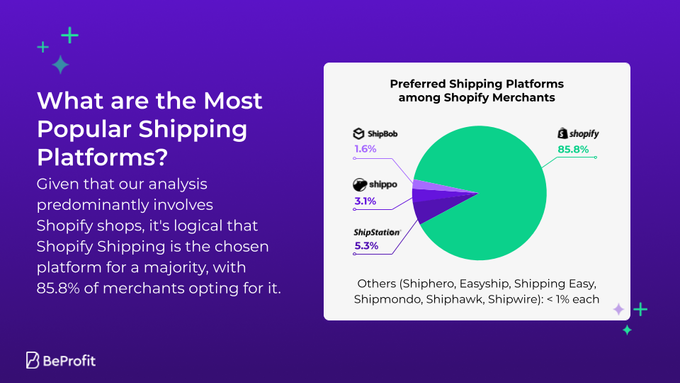
Analyzing the Impact of Different Shipping Platforms on Profits
Selecting an optimal shipping platform for your business has a direct impact on your operational efficiency and profit margins. And it’s not a one-time mission. Things change, that’s why It's essential to monitor how each platform affects your bottom line in real-time and revise trends in your shipping costs every once in a while.
In this chapter, we're going to break down the most popular shipping platforms among our customers and see how they impact their profitability.
Which Carrier is the Most Efficient?
The eCommerce world thrives on instant gratification. Shoppers want to click, buy, and have their products delivered yesterday. How does your business measure up when it comes to shipping times?
Monitoring your carrier's efficiency can be significant to your business, helping you build trust in your brand and enlarge your loyal customer base.
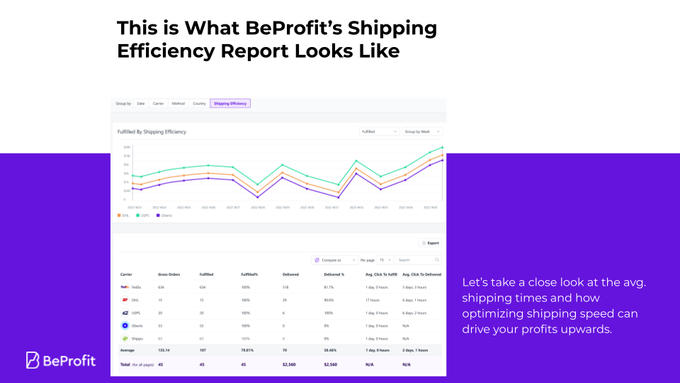
Get access to data about your shipping efficiency:
Book a Short Demo | Free Trial
Benchmarking Your Shipping Times Against The U.S. Average
The average click-to-door time for U.S. brands is 4.87 days. This golden nugget comes from PrettyDamnQuick, our partners, together we provide you with game-changing insights that'll turn you into a shipping master.

Expert Insight: The Winning Trio for Shipping Excellence
Avi Moskowitz, CEO at PrettyDamnQuick, points out three critical factors:
- Win customers in your local geography first - offer local customers personalized shipping options such as 'same-day or next-day delivery.'
- Use a multi-carrier platform - customers desire a variety of shipping options, such as 'Free,' 'Express,' and 'Overnight,' to give them control and flexibility over when they'll receive their order.
- Show a precise delivery promise in checkout - Include specific 'Arrives By' dates on each shipping option so customers know when they will receive their orders."

Game-Changing Shipping Insights
Our collaboration with PrettyDamnQuick, gives access to all the key metrics related to shipping that eCom businesses need to track and monitor.
On top of the reports presented earlier, we offer three types of metrics to analyze your shipping profitability - performance, retention, and cohort.
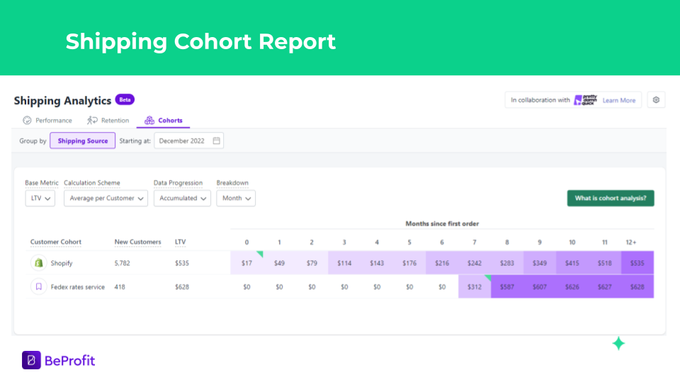
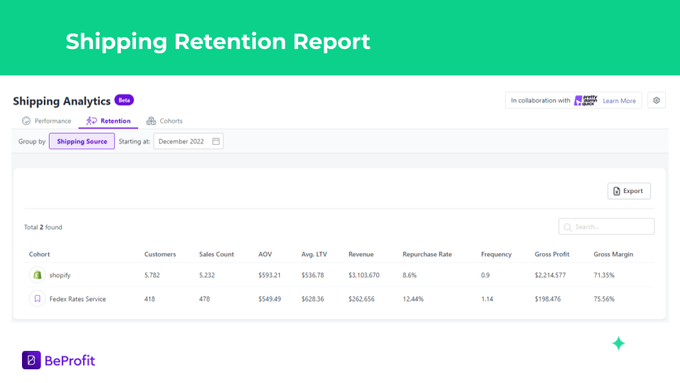
This means you can have a full grasp of how shipping times impact your profitability and customer loyalty, without breaking a sweat.
Get access to all these metrics:
Book a Short Demo | Free Trial
Turn Shipping into a Profit-Boosting Strategy with BeProfit
Choosing your shipping delivery options is an important strategic move. It's not just about satisfying customers; it's about fostering repeat business, driving larger purchases, and boosting your bottom line.
BeProfit's comprehensive reports allow you to monitor trends in your shipping delivery, and assess how your shipping options impact profitability, and their efficiency.
But it’s more than just shipping. BeProfit’s lets you view your revenue, expenses, profit, and all critical metrics, up to the moment, reveal your profit per product, country, platform, and shop, see the impact of expenses on your business, and much more.
Interested in drilling down to your data?